

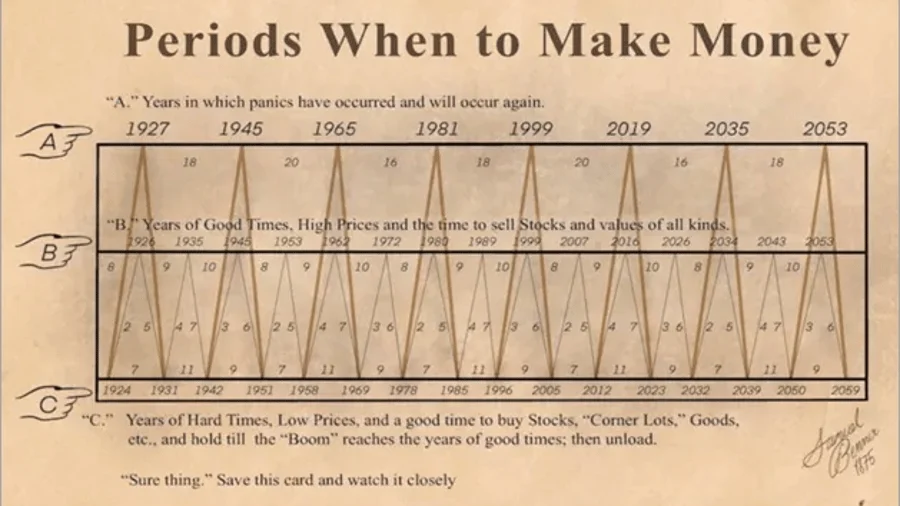
For generations, the dream of the "perfect trade" has captivated the imagination of investors. The allure is simple: if one could predict the inevitable ebb and flow of global stock markets, financial independence would be a matter of mere timing. This quest for the "Holy Grail" of market forecasting has led many to cling to a mysterious, decades-old relic that periodically resurfaces in online trading forums, YouTube investment channels, and financial blogs: the "Periods when to make Money" chart.
Dating back to the 1870s, this hand-drawn graphic purports to map out the cyclical nature of the financial markets, offering specific guidance on when to buy and sell. In an era of high-frequency trading and sophisticated artificial intelligence, it seems absurd that an artifact from the age of steam engines and telegrams could still command attention. Yet, its influence persists, fueled by claims that it accurately "predicted" the Great Depression of 1929, the dot-com bubble of the early 2000s, and the 2020 pandemic-induced market crash. As the year 2026—a date explicitly marked for a significant sell-off on the chart—arrives, it is time to peel back the layers of this financial folklore and distinguish between legitimate market analysis and pseudo-scientific mysticism.
The Origins of a Victorian Prophecy
The true genesis of this chart is shrouded in historical ambiguity. Academic researchers and financial historians have struggled to pinpoint a definitive source, leading to two competing narratives. The first suggests the chart originated with Samuel Bennet, a 19th-century pig farmer who, ironically, was attempting to project price cycles for livestock and corn into the coming century. The second theory attributes the work to a man named George Tritch, who reportedly extended the projections through the year 2059, injecting a significant dose of astrology into the data.
This astrological foundation is precisely where the chart’s credibility crumbles for serious market observers. While the graphic presents itself as a cycle-based forecasting tool, its underlying logic is not rooted in economics, interest rates, or corporate earnings, but rather in the movement of planetary bodies. Despite the lack of empirical financial evidence, the chart has gained a cult following, with some internet analysts claiming it possesses an astonishing 90 percent accuracy rate.
The Anatomy of an Illusion: Why We See Patterns
To understand why this chart continues to deceive, one must look at the psychological biases of the human brain. Andreas Hackethal, Professor at the Leibniz Institute for Financial Research SAFE in Frankfurt, offers a sober assessment of the phenomenon. "There is a deep-seated need among market participants to find long-term regularities in the inherent randomness of stock movements," Hackethal explains.
The perceived "accuracy" of the 1870s chart is not a triumph of predictive power; it is a statistical fallacy born of confirmation bias. "If you had asked a hundred people one hundred years ago to write down a forecast for the stock market, the probability is high that at least one of them would have been relatively accurate," Hackethal notes. "We have long forgotten all the other, incorrect predictions."
In the world of finance, this is known as the "survivorship bias." We only remember the "prophets" who happened to guess right while ignoring the thousands of false alarms that have occurred throughout history. The fact that the chart aligned with certain market downturns in the past is not evidence of its future validity; it is the result of chance and the cyclical nature of human behavior, which often repeats itself regardless of celestial alignment.
The Complexity of Modern Markets
Critics of the chart, including institutional economists, argue that the world is far too complex for such rudimentary patterns to maintain relevance. While it is true that markets move in cycles, these are driven by tangible forces: supply and demand, technological revolutions, fiscal policy, and geopolitical shifts.
In the 19th century, market cycles were largely dictated by agricultural harvests and industrial bottlenecks. Today, we are governed by the rapid scaling of artificial intelligence, global supply chain interdependencies, and the influence of central bank interest rate adjustments. These factors interact in non-linear ways that no hand-drawn curve from the 1870s could possibly capture.
Furthermore, there is a fundamental logical flaw in the very concept of a public, long-term market prediction. If a specific date—such as a major sell-off in 2026—were truly predictable, market participants would act on that information immediately. "If everyone knew beforehand when a panic would break out, everyone would sell their assets in advance, and there would be no panic," Hackethal observes. "It is a prophecy that would destroy its own potential to come true."
The Psychology of the Investor
The persistence of this chart also reveals much about the modern retail investor. In an age of information overload, there is a comfort in simplicity. The chart offers a sense of control in a chaotic, unpredictable system. However, this comfort comes at a high cost.
Professor Hackethal points out that factors far more mundane—and sometimes bizarre—than astrology often influence the markets. Research has shown, for example, that the weather impacts trading volumes. "When the sun is shining and it is particularly warm outside, retail investors trade less," Hackethal explains. Conversely, those who do trade during pleasant weather tend to take on higher risks. Even more intriguing is the correlation between sports and market performance: studies have indicated that when a national team loses in a major tournament like the World Cup, the domestic stock market often experiences a measurable dip the following day.

These findings underscore the reality that markets are a reflection of human psychology, not a preordained destiny written in the stars or on a Victorian piece of paper.
The Myth of Market Timing
The most dangerous implication of following the 1870s chart is the temptation to engage in "market timing"—the strategy of moving in and out of the market to avoid downturns and capture upturns. Hackethal’s message to investors is blunt: "Market timing does not work."
The data consistently shows that the majority of stock market returns are concentrated in a very small number of "best" days. Missing just a handful of these high-performing sessions can be the difference between a successful investment journey and a mediocre one. "If you miss the top ten days, your returns in most years will slip into negative territory," he warns. The danger of constantly entering and exiting the market, based on ancient charts or current trends, is that the investor almost inevitably misses those critical periods of recovery.
Conclusion: A Strategy for the Real World
For the investor looking to navigate the uncertainty of 2026 and beyond, the solution lies not in esoteric predictions, but in fundamental discipline. The "laws" of the market are far more reliable than any 150-year-old prophecy.
Professor Hackethal outlines two cornerstones for successful long-term investing:
- Diversification: By spreading risk across a broad range of assets, sectors, and geographies, investors insulate themselves from the volatility that the 1870s chart attempts to "predict."
- Persistence: The ability to endure downturns without abandoning one’s long-term strategy is the single greatest predictor of wealth accumulation.
The siren song of the "Periods when to make Money" chart will likely continue to lure investors who seek an easy answer to the difficult question of how to grow wealth. However, the lesson remains clear: the financial markets are not a puzzle to be solved by ancient diagrams. They are a complex, dynamic, and essentially human system. Relying on such charts is not a strategy; it is a distraction from the proven principles of patient, diversified, and rational investing. As we navigate the complexities of the current economic landscape, we would do well to trust in evidence-based financial science rather than the fading ink of Victorian-era superstitions.